Improve Django Database Performance with AWS Performance Insights
2
In this post I want to share how I use Performance Insights to proactively improve database performance for Django web applications.
For those not familiar, Performance Insights is a tool within Amazon’s Relational Database Service (RDS) that shows load on your database via an easy to use dashboard.
The Problem
I recently implemented a new feature that hides a column of data if all of the rows in that field are blank. This task usually involves small datasets of 1,000 records. But there are some outliers that consist of 400,000 records or more.
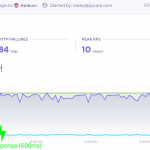
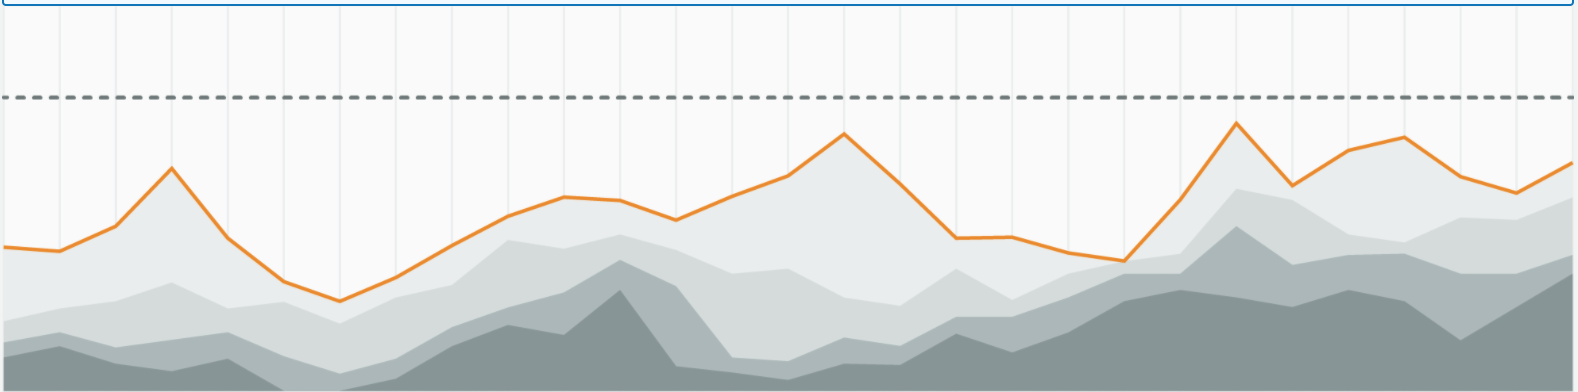
The outlier group started to cause issues with the web site, with response times occasionally spiking. When looking at the database statistics, I saw a spike in CPU usage around the same time that response times increased, so I knew something in the database was likely causing the problem.
Digging Deeper – Performance Insights
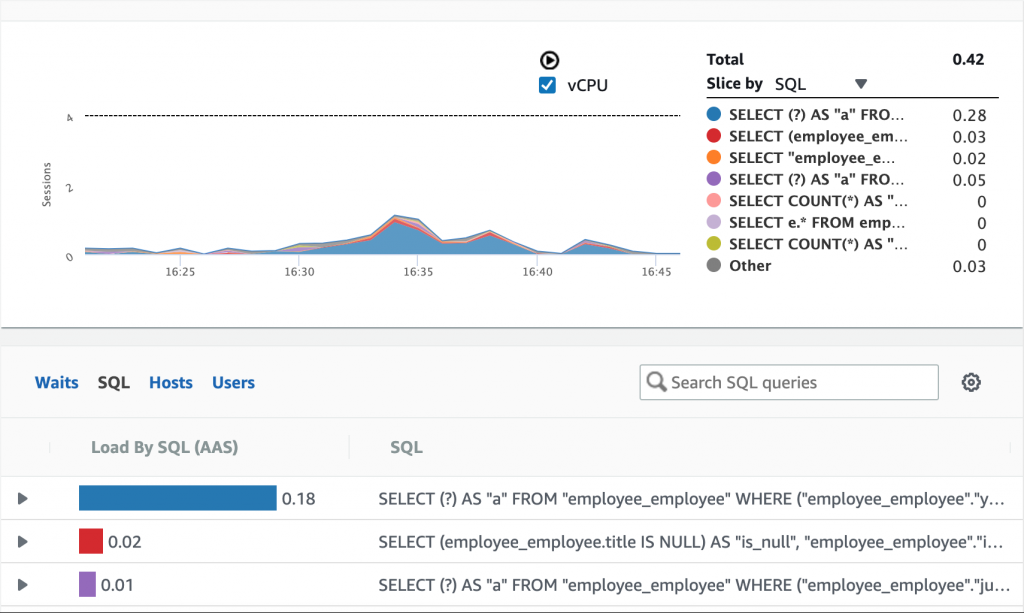
Performance Insights is enabled on the database so I decided to take a look. I changed the dropdown in the right column to ‘Slice by SQL’, then zoomed in on the timeframe with high load. This shows you the SQL queries that are putting load on the database, with the query causing the highest load at the top of the list:
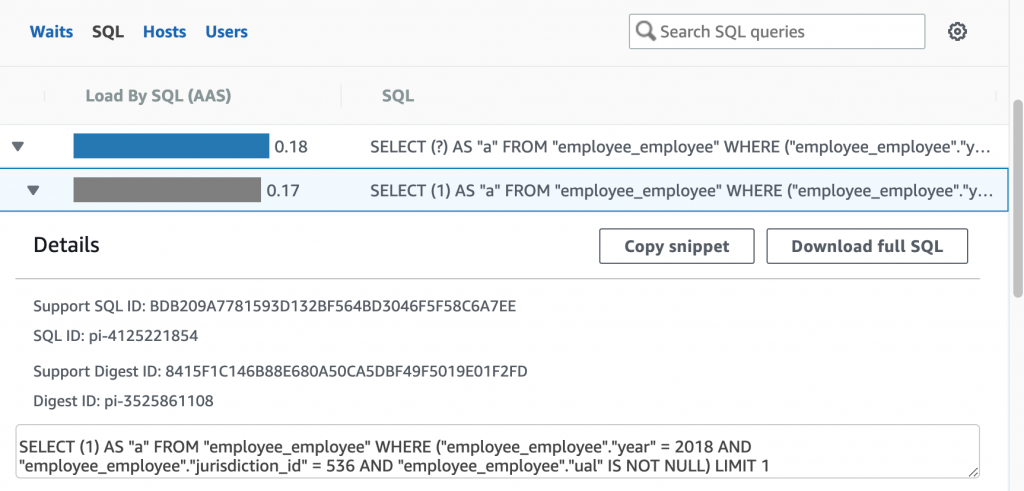
Clicking on the arrow in the list below the graph shows the entire query:
Analyzing the Query
Now it’s time to analyze the query further using my local copy of the database. We do this using PostgreSQL’s built-in EXPLAIN ANALYZE function that shows us how PostgreSQL builds its query plan, and how long it takes to run. You can do this in a terminal shell, but I prefer to use Jet Brains DataGrip software. Running the query in DataGrip looks like this:
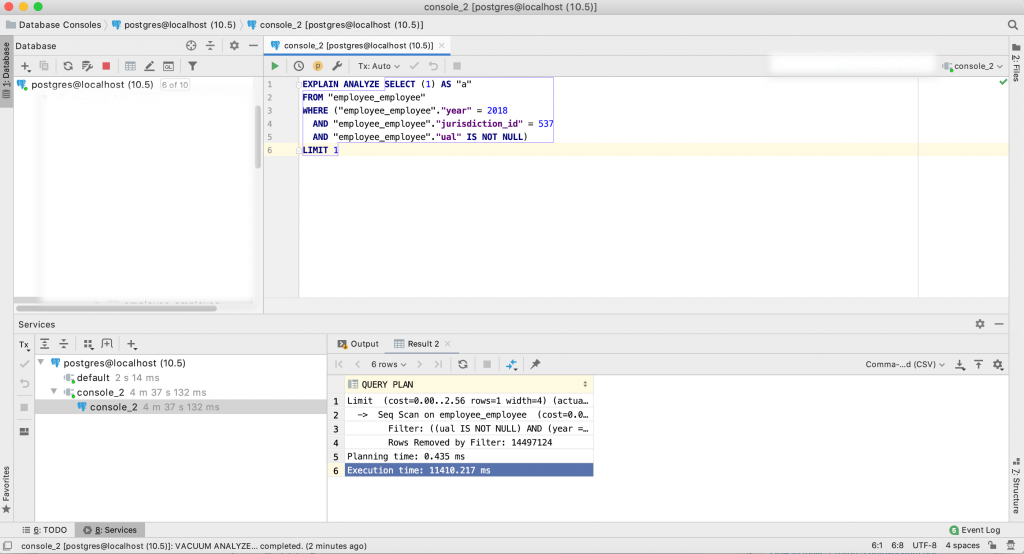
In case you cannot read the results in the image, the top portion is the query and the bottom portion is the query plan and time to execute, which is:
Limit (cost=0.00..2.56 rows=1 width=4) (actual time=11410.178..11410.179 rows=0 loops=1)
  -> Seq Scan on employee_employee (cost=0.00..503178.50 rows=196474 width=4) (actual time=11410.177..11410.177 rows=0 loops=1)
    Filter: ((ual IS NOT NULL) AND (year = 2017) AND (jurisdiction_id = 537))
    Rows Removed by Filter: 14497124
Planning time: 0.435 ms
Execution time: 11410.217 ms
As you can see, this query takes 11 seconds to run, and scans 14 million records in order to return a result!
Improving the Query
We know this query is causing problems. There are several ways to fix it:
- Determine if the query is necessary
- Rewrite the code that built the query
- Add an index to the database to improve query performance
In this instance, I do feel the query is necessary and after reviewing the code, I cannot think of a better way to write it. So I’m going to try option #3, adding an index to the database.
For tips on how on how and when to add an index, I recommend reading the excellent tutorial Use the Index, Luke! When I am stuck thinking about how to specifically implement an index, I usually consult Stack Exchange’s DBA section.
Adding an Index
After reviewing those resources I decided to add an index like this:
CREATE INDEX ON employee_employee (year, jurisdiction_id) WHERE ual IS NOT NULL;
To ensure the index is ready to use, we need to run ANALYZE on the table. This builds statistics that support the query analyzer:
ANALYZE employee_employee;
Let’s run the query once again with EXPLAIN ANALYZE:
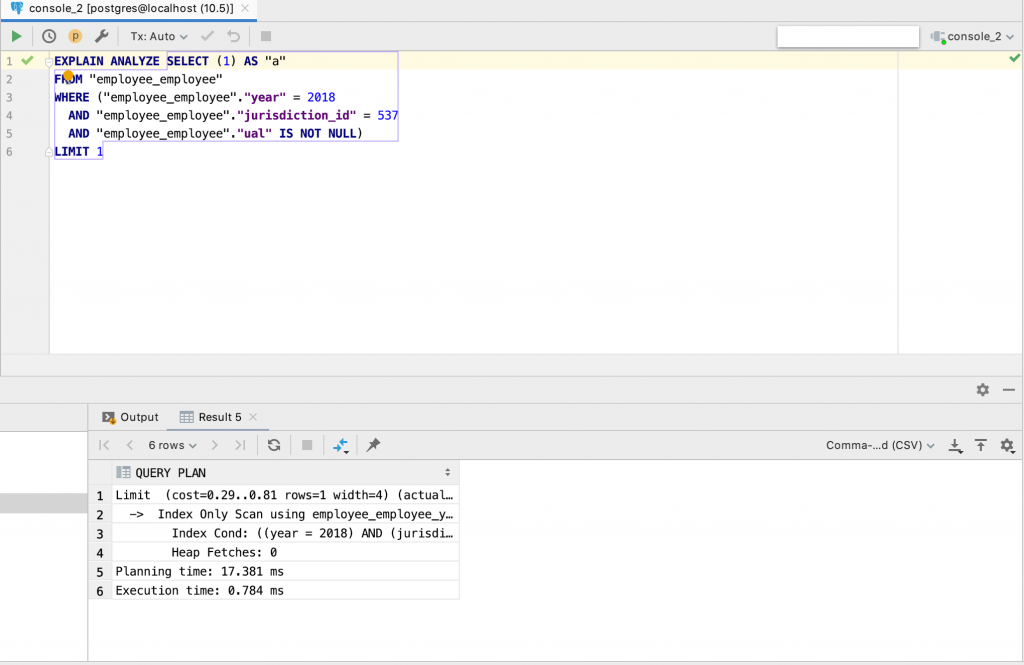
Adding the index improved the query run time from 11 seconds down to 18 milliseconds!
Limit (cost=0.29..0.81 rows=1 width=4) (actual time=0.693..0.693 rows=0 loops=1)
  -> Index Only Scan using employee_employee_year_jurisdiction_id_idx on employee_employee (cost=0.29..4.45 rows=8 width=4) (actual time=0.690..0.690 rows=0 loops=1)
    Index Cond: ((year = 2018) AND (jurisdiction_id = 537))
    Heap Fetches: 0
Planning time: 17.381 ms
Execution time: 0.784 ms
Happy with the results, I added the index to the production database. Over the next 24 hours, I saw the the problem was completely resolved.
Moving Forward
So what’s next? Continue optimizing! Go back to the top of the list and look at the next query. Can it be optimized in a similar way?
Keep in mind you do not have to wait for a problem to occur. Routinely optimizing queries is a healthy practice that will decrease load on your database, make your site faster, and ultimately improve the long-term stability of your web application.